
FloodCast
Measured first, modelled second.
FloodCast watches India's rivers and the glacial lakes of the Hindu Kush Himalaya, continuously and unattended. It serves what gauges and satellites measure the moment it arrives, and releases modelled layers only when they beat a persistence baseline.
Request a briefingDownload the brochure PDF, 8 pages, 3.5 MB
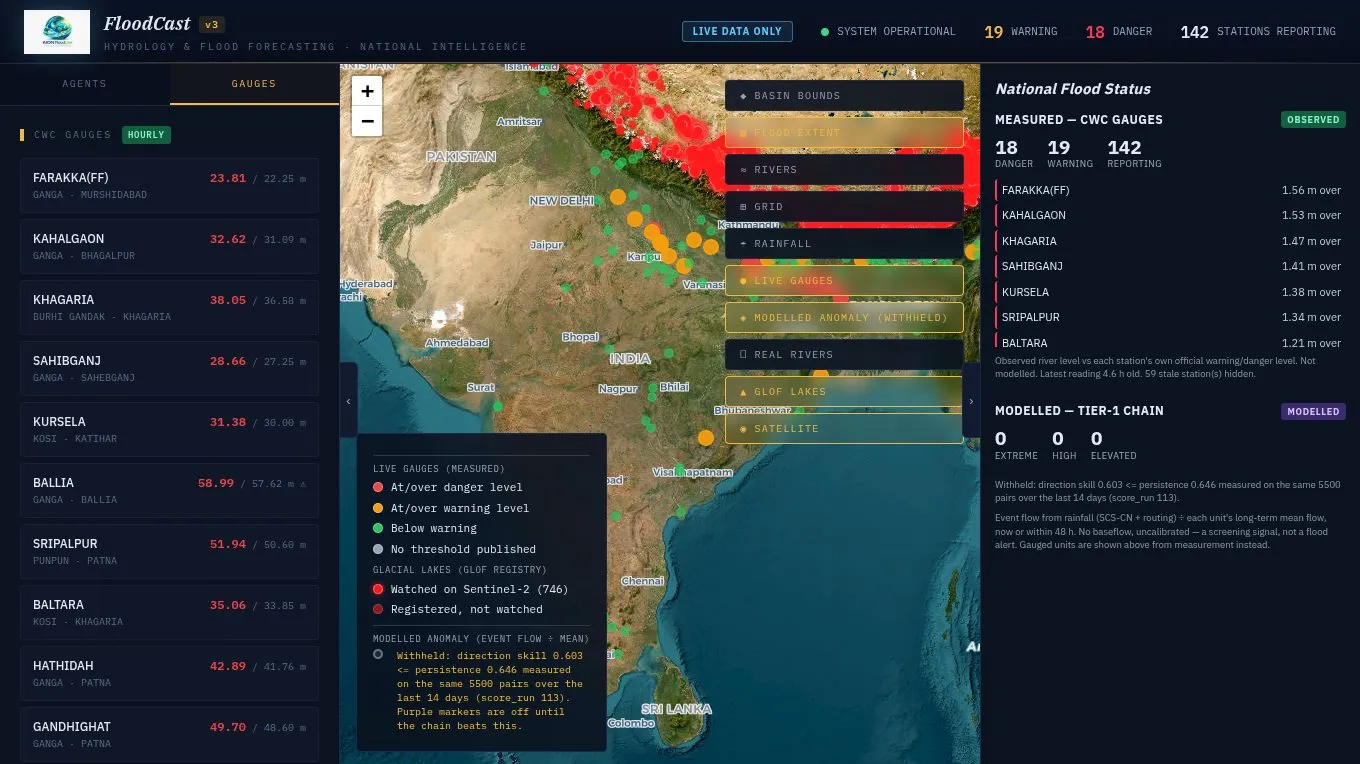
The gauge decides the colour
An alert is derived from the measurement alone: over the warning mark is warning, over the danger mark is danger. No model sits between the gauge and the map.
Lakes watched directly
A glacial lake outburst has no pathway in a rainfall model, so FloodCast watches the lakes on satellite imagery and watches the ground for quakes and landslides.
Models earn their release
The rainfall-to-runoff chain is scored every morning against the gauges and against persistence on identical pairs, and reaches the map only when it clears that bar.
What FloodCast is
A flood platform that tells you what it knows and what it is guessing.
FloodCast separates two kinds of information that most products blur: what has been measured by a gauge or a satellite, and what has been modelled from rainfall. The first is served the moment it arrives. The second is scored against the record every day, so what reaches the map has earned its place.
Measured observed
- CWC river gauges polled hourly, compared with each station's own official warning and danger levels.
- Glacial lakes measured on Sentinel-2 every day, with the usable-footprint fraction stored beside every reading.
- Mass-movement events from the USGS feed every five minutes, matched to the nearest lake and its downstream valley.
- Rainfall analysis and 48-hour forecast on 11,532 grid points, every unit forced from inside its own boundary.
Modelled modelled
- A national rainfall-to-runoff chain over 6,494 sub-basins, run three times a day to a 46-hour horizon.
- Scored every morning against the gauges and against a persistence baseline on identical pairs.
- Released to the map as it clears that bar: the release is earned on the scoreboard, not assumed.
- A daily 07:30 IST digest that carries observed alerts and forecast crossings, never modelled ones on their own.
- 200
- CWC river stations, observed hourly
- 6,494
- modelling units, HydroSHEDS level 8
- 3,553
- glacial lakes registered, 746 watched daily
- 11,532
- rainfall forcing points, none interpolated
- 5 min
- seismic feed cadence for outburst triggers
- 07:30 IST
- daily digest, delivered unattended
as shipped, 13 Sep 2026
The live map
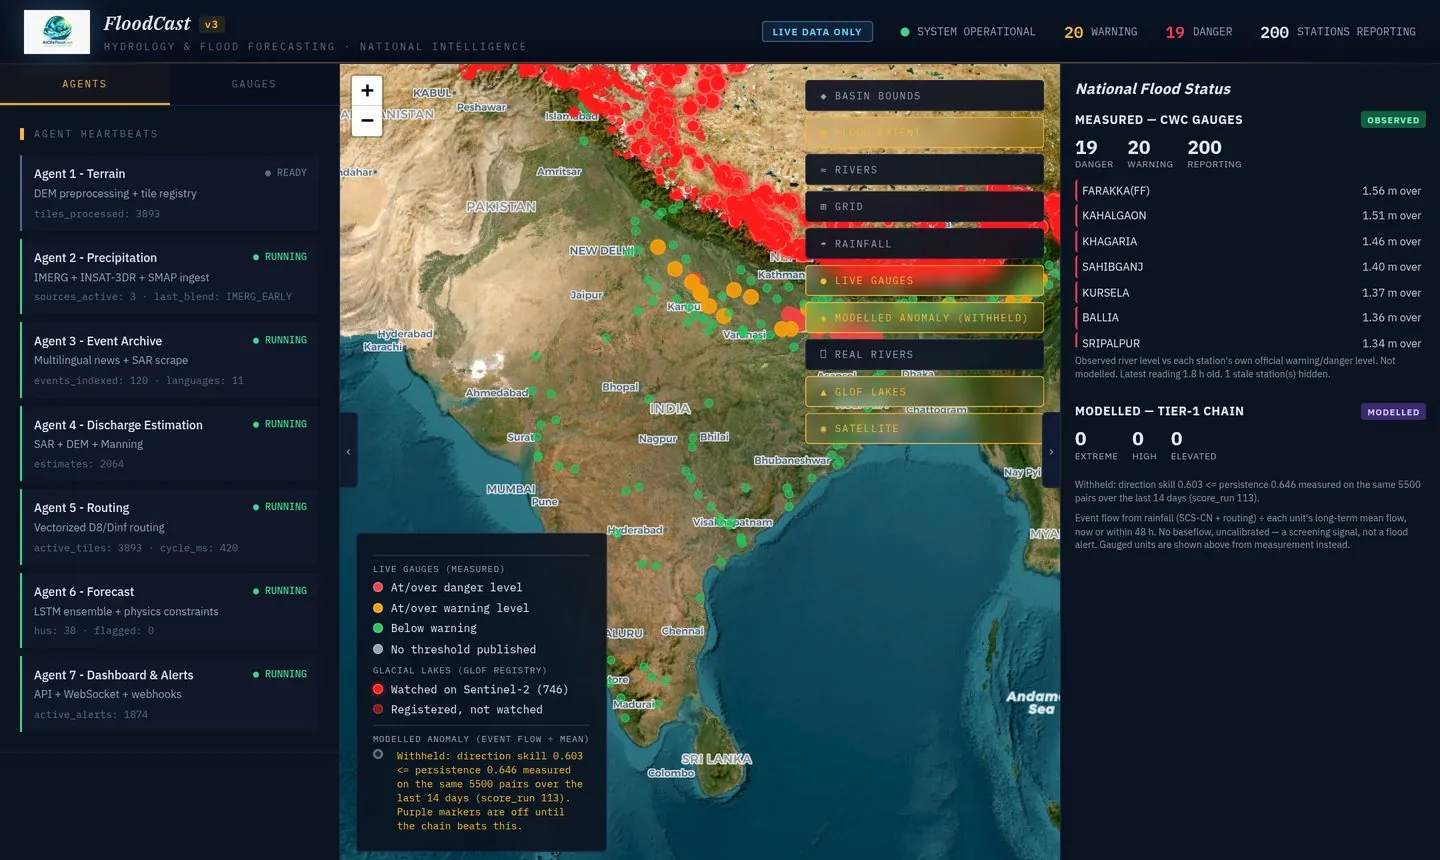
One screen, every source, each labelled by what it is.
Rules the map keeps
- Unknown is not normal
- A station with no published threshold is shown as unknown, never as normal.
- Stale is hidden
- A reading older than the staleness window is hidden from alerting, not silently reused.
- Units cannot be mixed
- River stage in metres and reservoir inflow in m³/s can never be compared; the database refuses the row.
- Basis on every response
- Every API response carries a basis field. Nothing synthetic is served.
| Layer | What it shows | Basis |
|---|---|---|
| Live gauges | Observed level against the station's own datum | observed |
| Glacial lakes | ICIMOD Hi-MAG 2017 registry | registry |
| Flow direction | Reach chain 60 km below each watched lake | terrain |
| Rainfall | Analysis and 48-hour forecast per unit | observed |
| Real rivers | HydroRIVERS, mean discharge in m³/s | terrain |
| Modelled anomaly | Event flow divided by long-term mean | modelled |
Rivers, measured
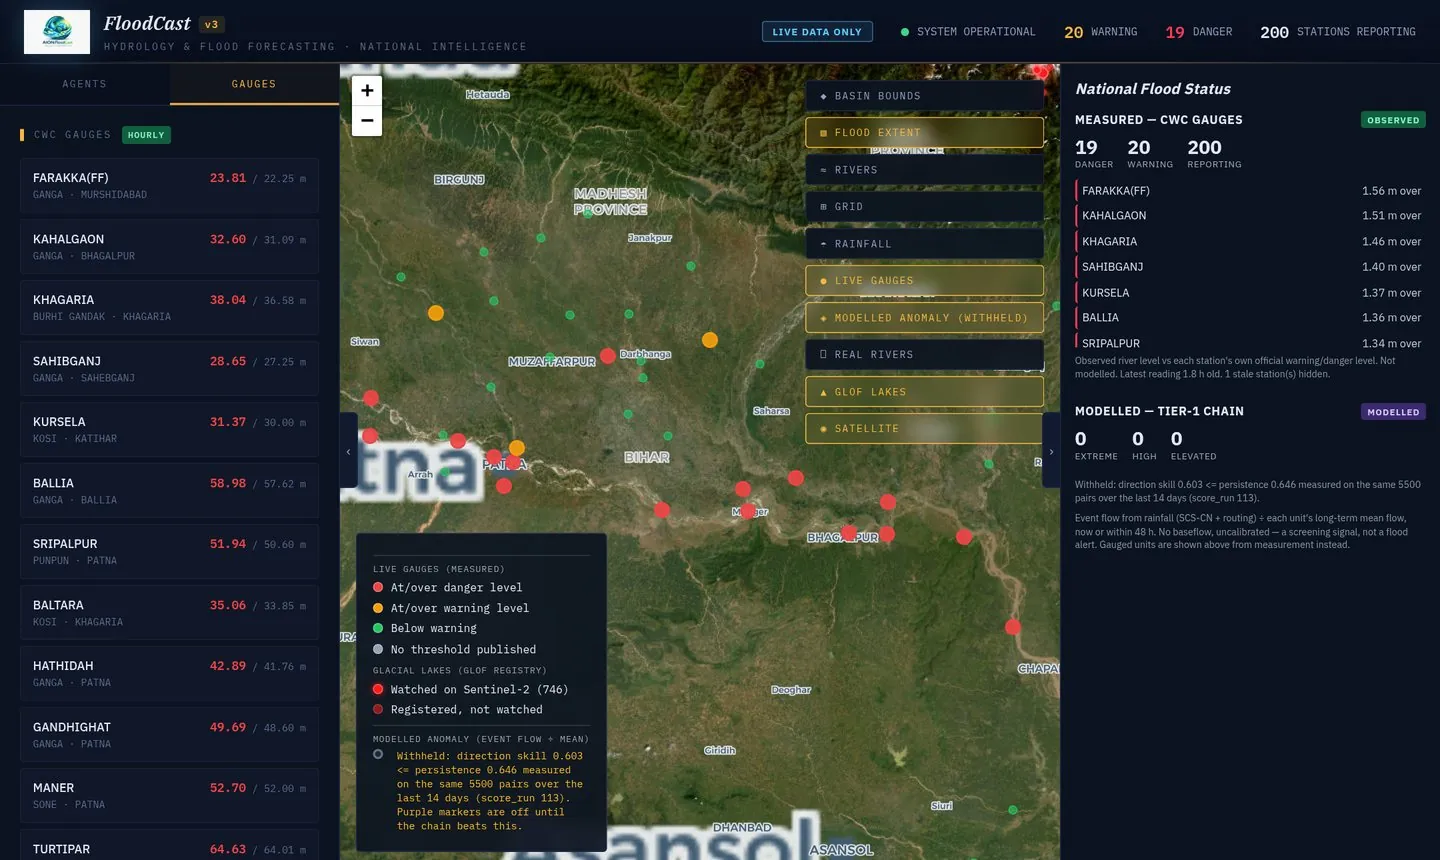
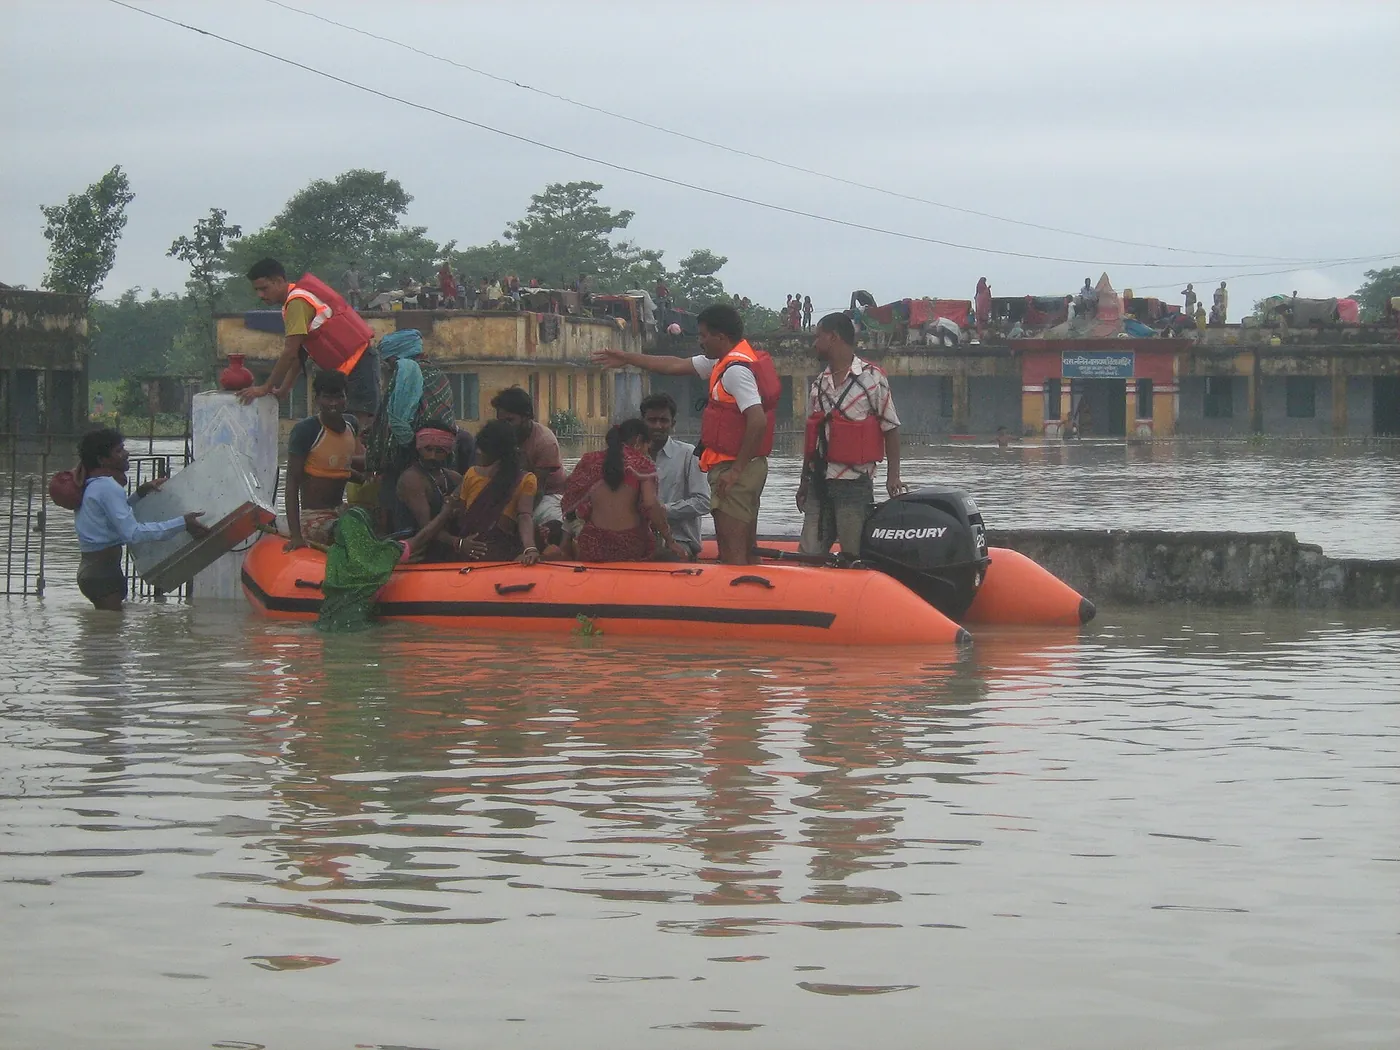
The Ganga and Kosi plains, gauge by gauge.
The Central Water Commission publishes observed water levels for about two hundred river stations together with each station's warning level, danger level and highest flood level. FloodCast reads that feed hourly and derives the alert from the measurement alone: over the warning mark is warning, over the danger mark is danger. No model sits between the gauge and the colour.
Each morning at 07:30 IST a digest lists every station at danger or warning, any new crossings since the previous day, and the forecast crossings CWC itself has published. It is sent whether or not anyone is watching.
CWC's own published forecasts are scored on the same basis as ours, one pair per distinct forecast statement, and that is the bar the modelled chain must clear. The scoreboard is generated by the scorer, not written by hand, and it decides what reaches the operational map.

Glacial lakes
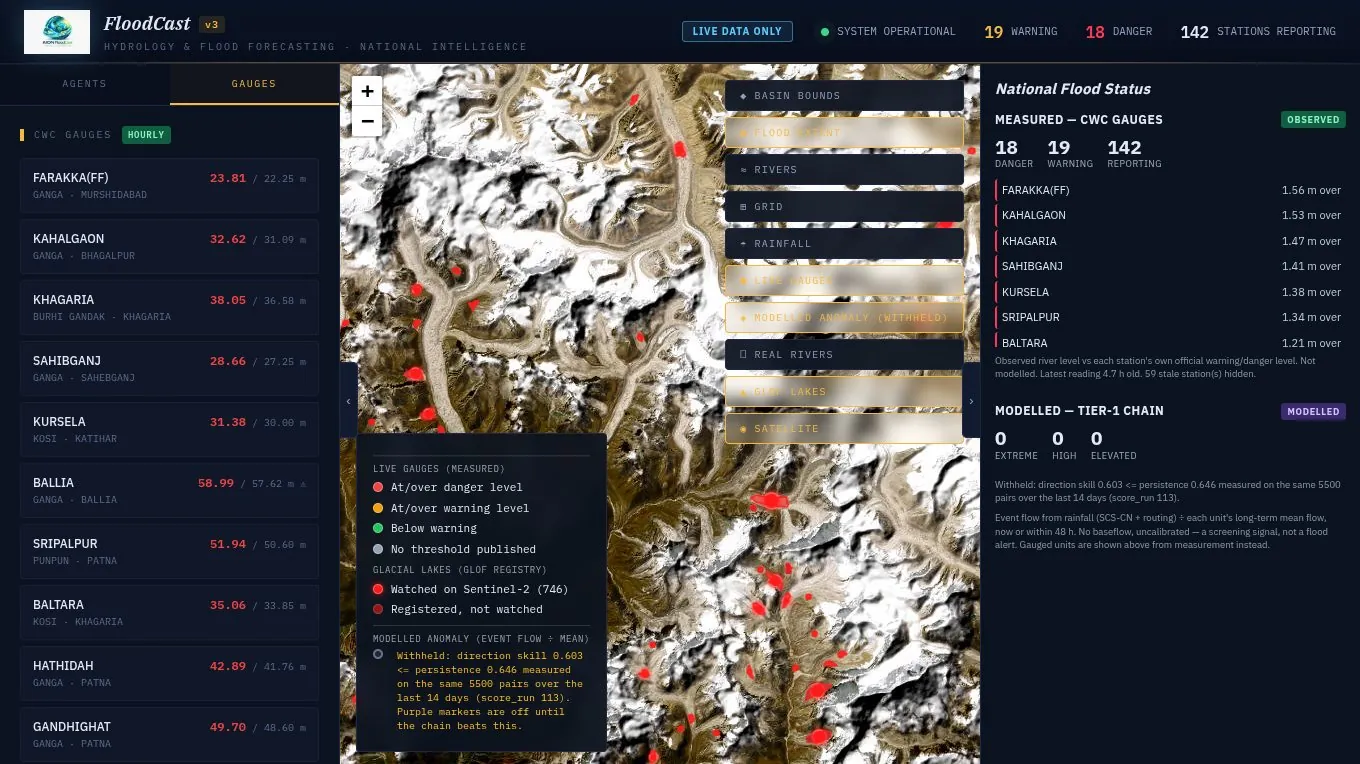
From the lake to the valley below.
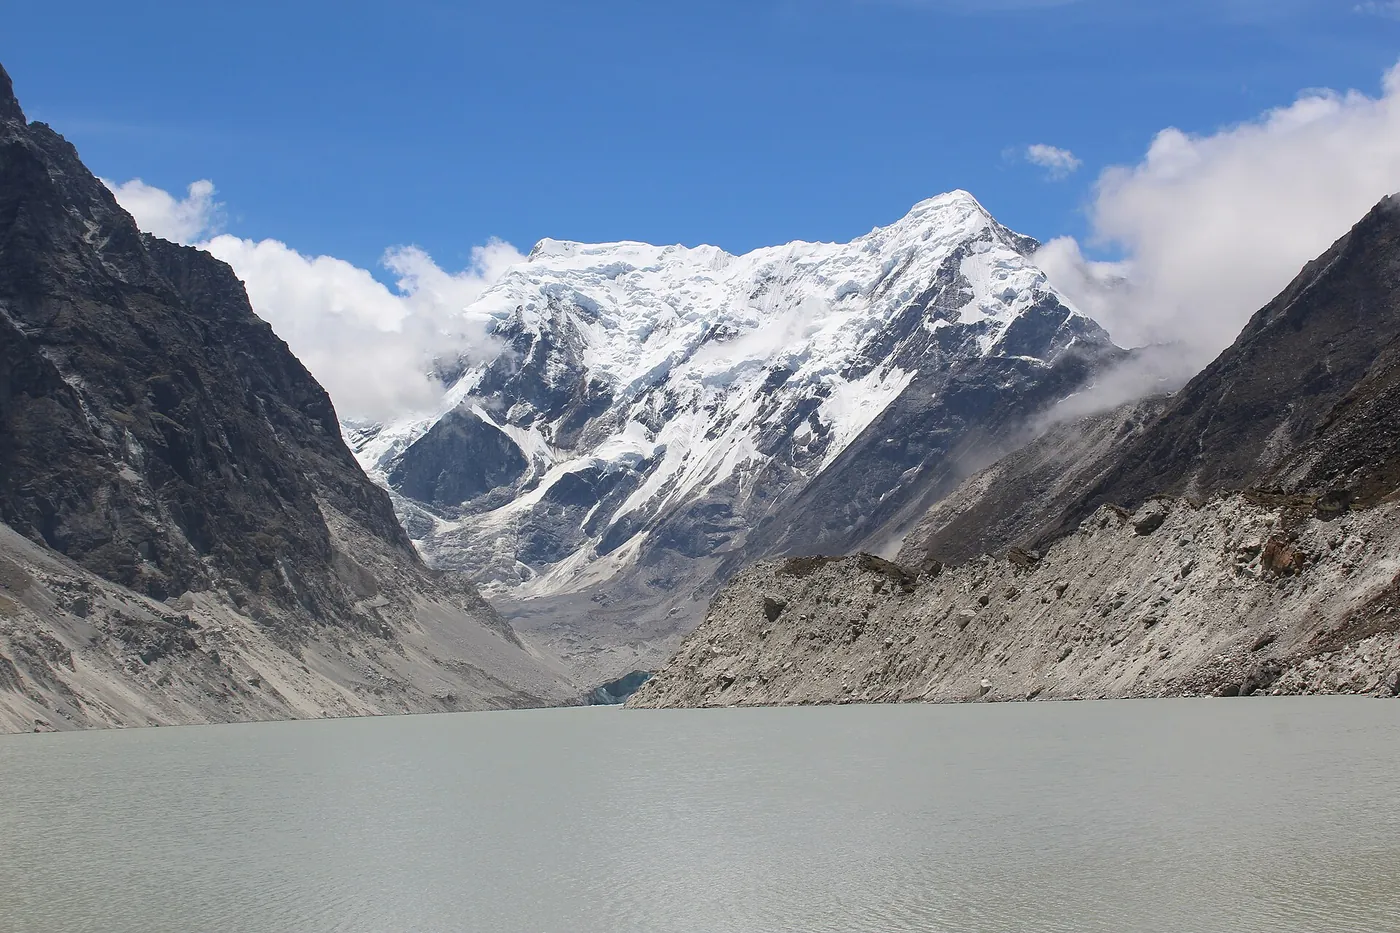
A glacial lake outburst has no pathway in a rainfall model. Nobody predicted the 26 August 2026 Bhote Koshi event from rain. FloodCast therefore watches the lakes directly, and watches the ground that can dam or breach them.

- Registry
- 3,553 lakes over 0.05 km² from the ICIMOD Hi-MAG 2017 inventory, with elevation, dam type and the 40 ranked potentially dangerous lakes.
- Seismic watch
- The USGS feed polled every five minutes. Any earthquake or landslide within the Himalayan hull is classified, matched to its nearest lake and unit, and alerted once.
- Optical monitor
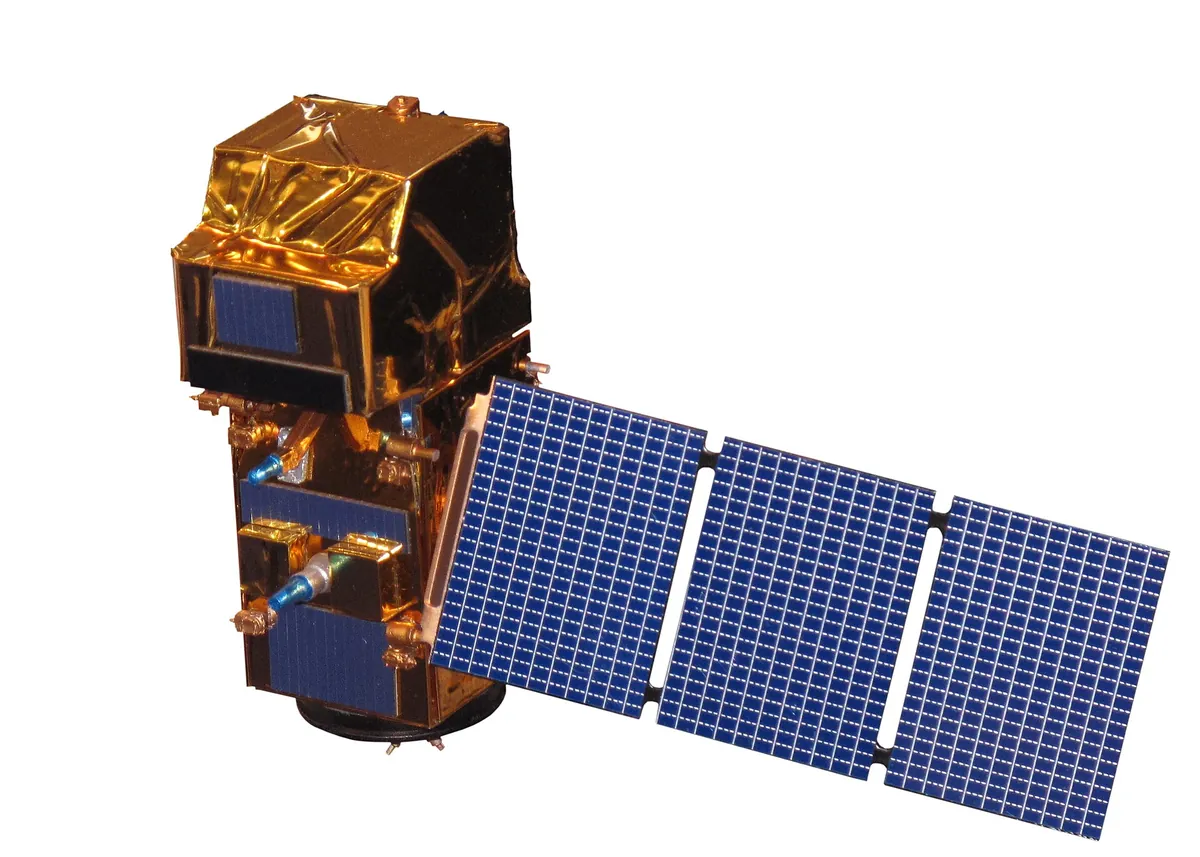
- 746 watched lakes measured daily on Sentinel-2. Every scene read is stored, including the unusable ones, so "we could not see it" is auditable.
- Barrier check
- After a mass movement, the valley 25 km downstream is compared before and after for new water: a landslide dam forming behind a valley.
Rainfall to runoff
The national chain: rainfall to river, three times a day.
Rainfall analysis and forecast arrive on 11,532 grid points, enough that every one of the 6,494 sub-basins is forced from points inside its own boundary rather than interpolated from a neighbour. Runoff is generated with curve numbers from the published GCN250 dataset and terrain from Copernicus GLO-90, then routed downstream through the HydroSHEDS network three times a day to a 46-hour horizon.
Each morning the chain is scored on every gauge: did the river rise or fall over the next 24 hours, and did the model call it? The same question is put to a persistence baseline and to CWC's published forecast, on identical station-and-time pairs, about 5,500 station-hours a fortnight. The chain is recalibrated from that record, not from assumptions.
Every sub-basin carries real curve numbers and real slope, and every forecast is archived at issue time. The archive is what lets the chain be scored honestly and improved from evidence rather than tuned by eye.
Sources and operations
Open data, own infrastructure, no keys in the browser.
Eleven scheduled services run on AION's own cloud fleet: hourly gauge crawl, rainfall and chain three times a day, seismic watch every five minutes, and the lake monitor, scorer and digest daily. PostGIS holds everything, with constraints that reject a wrong unit or a threshold on the wrong kind of station. The dashboard reaches the engine only through an authenticated gateway; the browser never holds a data key.
.jpg)
| Data | Source |
|---|---|
| River levels | Central Water Commission, observed hourly |
| Rainfall | Open-Meteo, analysis and forecast |
| Basins and rivers | HydroSHEDS HydroBASINS and HydroRIVERS v1 |
| Curve numbers | GCN250, CC BY 4.0 |
| Terrain | Copernicus DEM GLO-90 |
| Glacial lakes | ICIMOD Hi-MAG 2017, CC BY 4.0 |
| Lake imagery | Copernicus Sentinel-2 L2A, via Earth Search |
| Seismic | USGS real-time feed |
| Reservoir level | NASA ICESat-2 ATL13, validation only |
What comes next
Extended where the data allows.
- Radar
- Sentinel-1 SAR for cloud-proof lake and barrier detection; the 26 August barrier lake was invisible to optical imagery in every one of eight scenes.
- Reservoir levels
- ICESat-2 altimetry for storage trends, never for alerting, because of its latency.
- 3D terrain view
- The Himalayan arc in relief, with lakes and flow paths draped on real elevation.
- The modelled layer
- The next iteration shaped by the scoreboard: an anomaly product for the plains and a dedicated outburst pathway for the mountains.
What it does
- About 200 Central Water Commission river stations, observed hourly as shipped, 13 Sep 2026
- 3,553 registered glacial lakes, 746 measured daily on Sentinel-2 as shipped, 13 Sep 2026
- USGS seismic feed polled every five minutes for outburst triggers
- Rainfall analysis and forecast on 11,532 grid points, none interpolated as shipped, 13 Sep 2026
- Rainfall-to-runoff chain over 6,494 sub-basins, three times a day modelled, released as it clears its bar
- A 07:30 IST digest of stations at warning or danger and new crossings
Every API response carries a basis field, observed or modelled. Nothing synthetic is served.
Who it is for
- State and national disaster management authoritiesObserved gauge and lake alerts with a daily digest that arrives whether or not anyone is watching.
- Water resources engineers and reservoir operatorsEvery CWC station against its own warning and danger marks, with flow paths below each watched lake.
- Insurers and researchersAn archive of forecasts as issued and a scoreboard generated by machine, not by hand.
Access
FloodCast is live at flood.aipower.guru behind a credentialed gate.
Briefing
Your basins, lakes and alert thresholds walked through on the live map.
Access
Credentialed accounts per organisation, with the daily digest.
Extend
Your own gauges and reservoirs added as observed layers.
Who gets access
Access is granted per organisation to emergency managers, water authorities, insurers and researchers. The observed layers and the daily digest are available today; modelled layers follow as they clear their bars.
Request a briefing
Write to us and we will set up a walkthrough of FloodCast on live data.
Email info@aionpl.com